Comprehensive Regulatory Information Management (RIM) systems contain a treasure trove of information and companies spend millions of dollars and thousands of hours inputting data into them. But are they using the power of analytics to leverage their data and make better business decisions faster?
Here, we review how a market-leading analytics tool paired with an advanced RIM solution can help turn data into intelligence for optimal insights into end-to-end business processes.
The State of RIM Today
Market Authorisation Holders (MAHs) have multiple internal (business focused) and external (regulator focused) drivers for managing their data in a RIM system.
Historically, MAHs have been very effective at creating reports which produce tables of planned, ongoing, or complete activity; and somewhat effective at giving their data governance teams KPI and DQ tools to aid checking data entry compliance. But they have not been effective at value adding analytics. With IDMP, there has been a paradigm shift in recent years to build business cases around the use of RIM data – not only to be compliant but to extrapolate the data to drive positive business change.
Using a powerful report building tool like Power BI, MAHs can create not only paginated reports for detailed data requirements but also reports to support internal teams in the optimization of business processes. Such reports can track project progression from planning through approval to help manage RIM and the wider company processes which RIM feeds into.
With so much time and effort spent entering the data, looking at how to leverage this vast library of information to improve and accelerate business decision making is a justifiable investment.

“By utilizing the power of analytics with the data already entered into the RIM system, MAHs can make better informed business decisions, faster.”
– Daniel Smith, Business Analyst, RIM, Calyx
Three RIM Analytics “Data into Intelligence” Use Cases
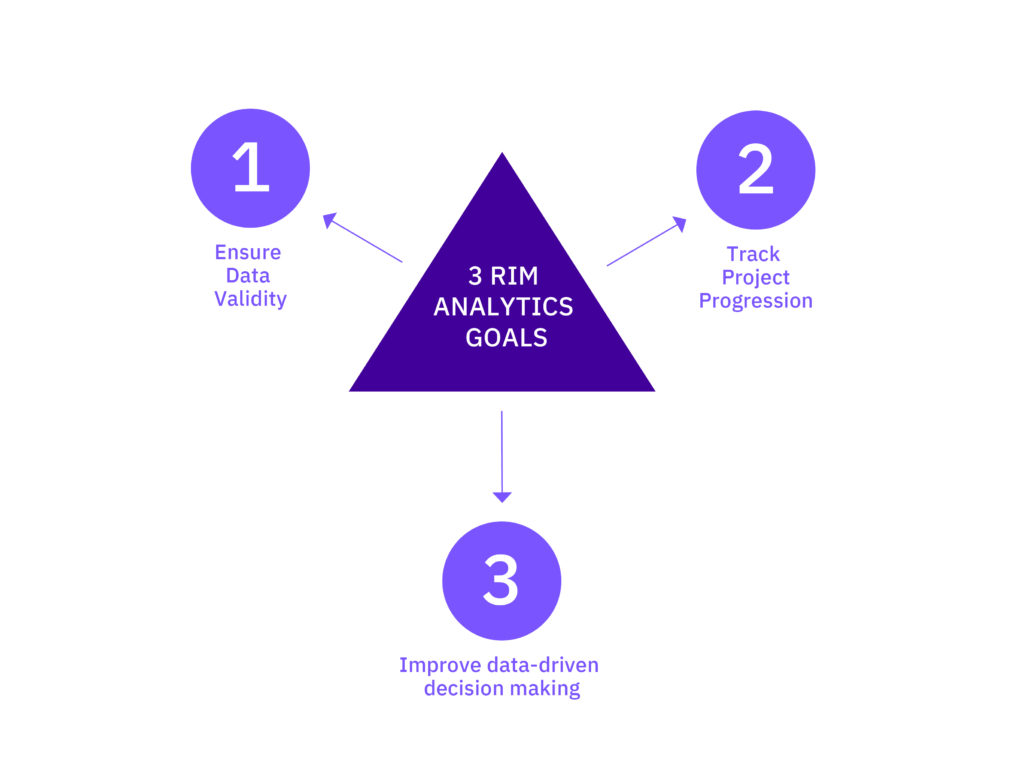
Understanding that data is input into RIM systems to a) manage and ultimately fulfil regulatory requirements, but also to b) monitor ongoing business activities and derive additional value, the goal of RIM analytics should be threefold:

Figure 1
Power BI fuels these goals and enables companies to improve processes and make better business decisions. Here are three use cases for the Pharmaceutical industry.
1. Managing the supply of varied products following a CMC variation
Analytics can identify the markets for varied product compliance throughout the worldwide roll-out of a Chemistry, Manufacturing, and Controls (CMC) variation. Ensuring the distribution of the correct product version to each country is of paramount importance. By combining market-specific variation intelligence e.g. “Type II tell & do,” “Type IA do & tell” with country-specific submission status, manufacturing and product supply teams can monitor the flow of markets from noncompliant to compliant, and so be advised when they may implement a planned network change. Using data from the RIM system, they can see an overview of all the countries in the world for which regulatory activity is still ongoing and plan their stock and implementation accordingly.
2. Planned Renewals and PSURs submission tracking
All regulator-demanded periodically required submission types, for example, Periodic Safety Update Reports (PSURs) and Renewals, have due dates that are driven by data already in RIM. Therefore, utilizing your RIM system to highlight missing planned submissions as well as the progress for all ongoing submissions against internal milestones obviates the compliance risk for associated licenses.
3. Planned and ongoing submission activity tracking worldwide
Analytics can be used to identify potential bottlenecks in all end-to-end business processes tracked by the RIM system. Providing insights that can be used in central authoring, publishing, and support teams, as well as within country affiliates empowers companies to ensure that they have the right people in the right place at the right time to support their product portfolio and its associated regulatory activities.

Figure 2 – Dashboard-style reports utilizing Power BI’s graphics-rich capabilities provide a comprehensive overview of worldwide submission activity and resulting registrations, and act as a visual doorway into RIM data.
Redefining RIM Analytics through Power BI
Power BI is simplifying report building and data access for all parties by making it significantly easier for [even non-technical] users to create and publish reports. In turn, making it vastly easier for business users, company-wide, to leverage the valuable insights that their RIM system contains.
Dashboard-style reports utilizing Power BI’s graphics-rich capabilities provide a comprehensive overview of worldwide submission activity and resulting registrations, and act as a visual doorway into RIM data (Figure 2). Easy-to-digest summaries of all registrations and submissions enable users to drill down into detail when detail is required.
Power BI enables users to understand complex situations in mere seconds – a task that would normally take an hour of laboriously dissecting and analyzing excel spreadsheets. In Power BI information starts simple and only gets complex should you need it to – for example a heat map summarizing where in the world a particular variation is planned, dispatched, submitted, or approved.
And of course, audit trail information is also visible to Power BI so you are not limited to reporting how data looks today. You can compare current data with last week’s data, last month’s data, last year’s data to monitor the progress of data entry should any specific business use case demand it.


